Your data probably already has the answer. The question is whether your tools can surface it.
Your data probably already has the answer. The question is whether your tools can surface it.
This is one of the most common frustrations I hear from chemists.
You've run tens of experiments. Different temperatures, solvent ratios, additives, reaction times - all of it captured. All of it sitting there.
And yet, the pattern that could inform your key insight may remain invisible.
Not because the data isn't good enough.
Because the tools weren't built to surface it.
A spreadsheet can store hundreds of experiments. It was never designed to show you what they mean.
This is exactly the problem we set out to solve at @ReactWise - giving process R&D teams the ability to move from raw experimental data to actionable insight, without needing to be a data scientist to get there.
The best process chemists shouldn't be fighting their tools.
They should be making decisions with them.
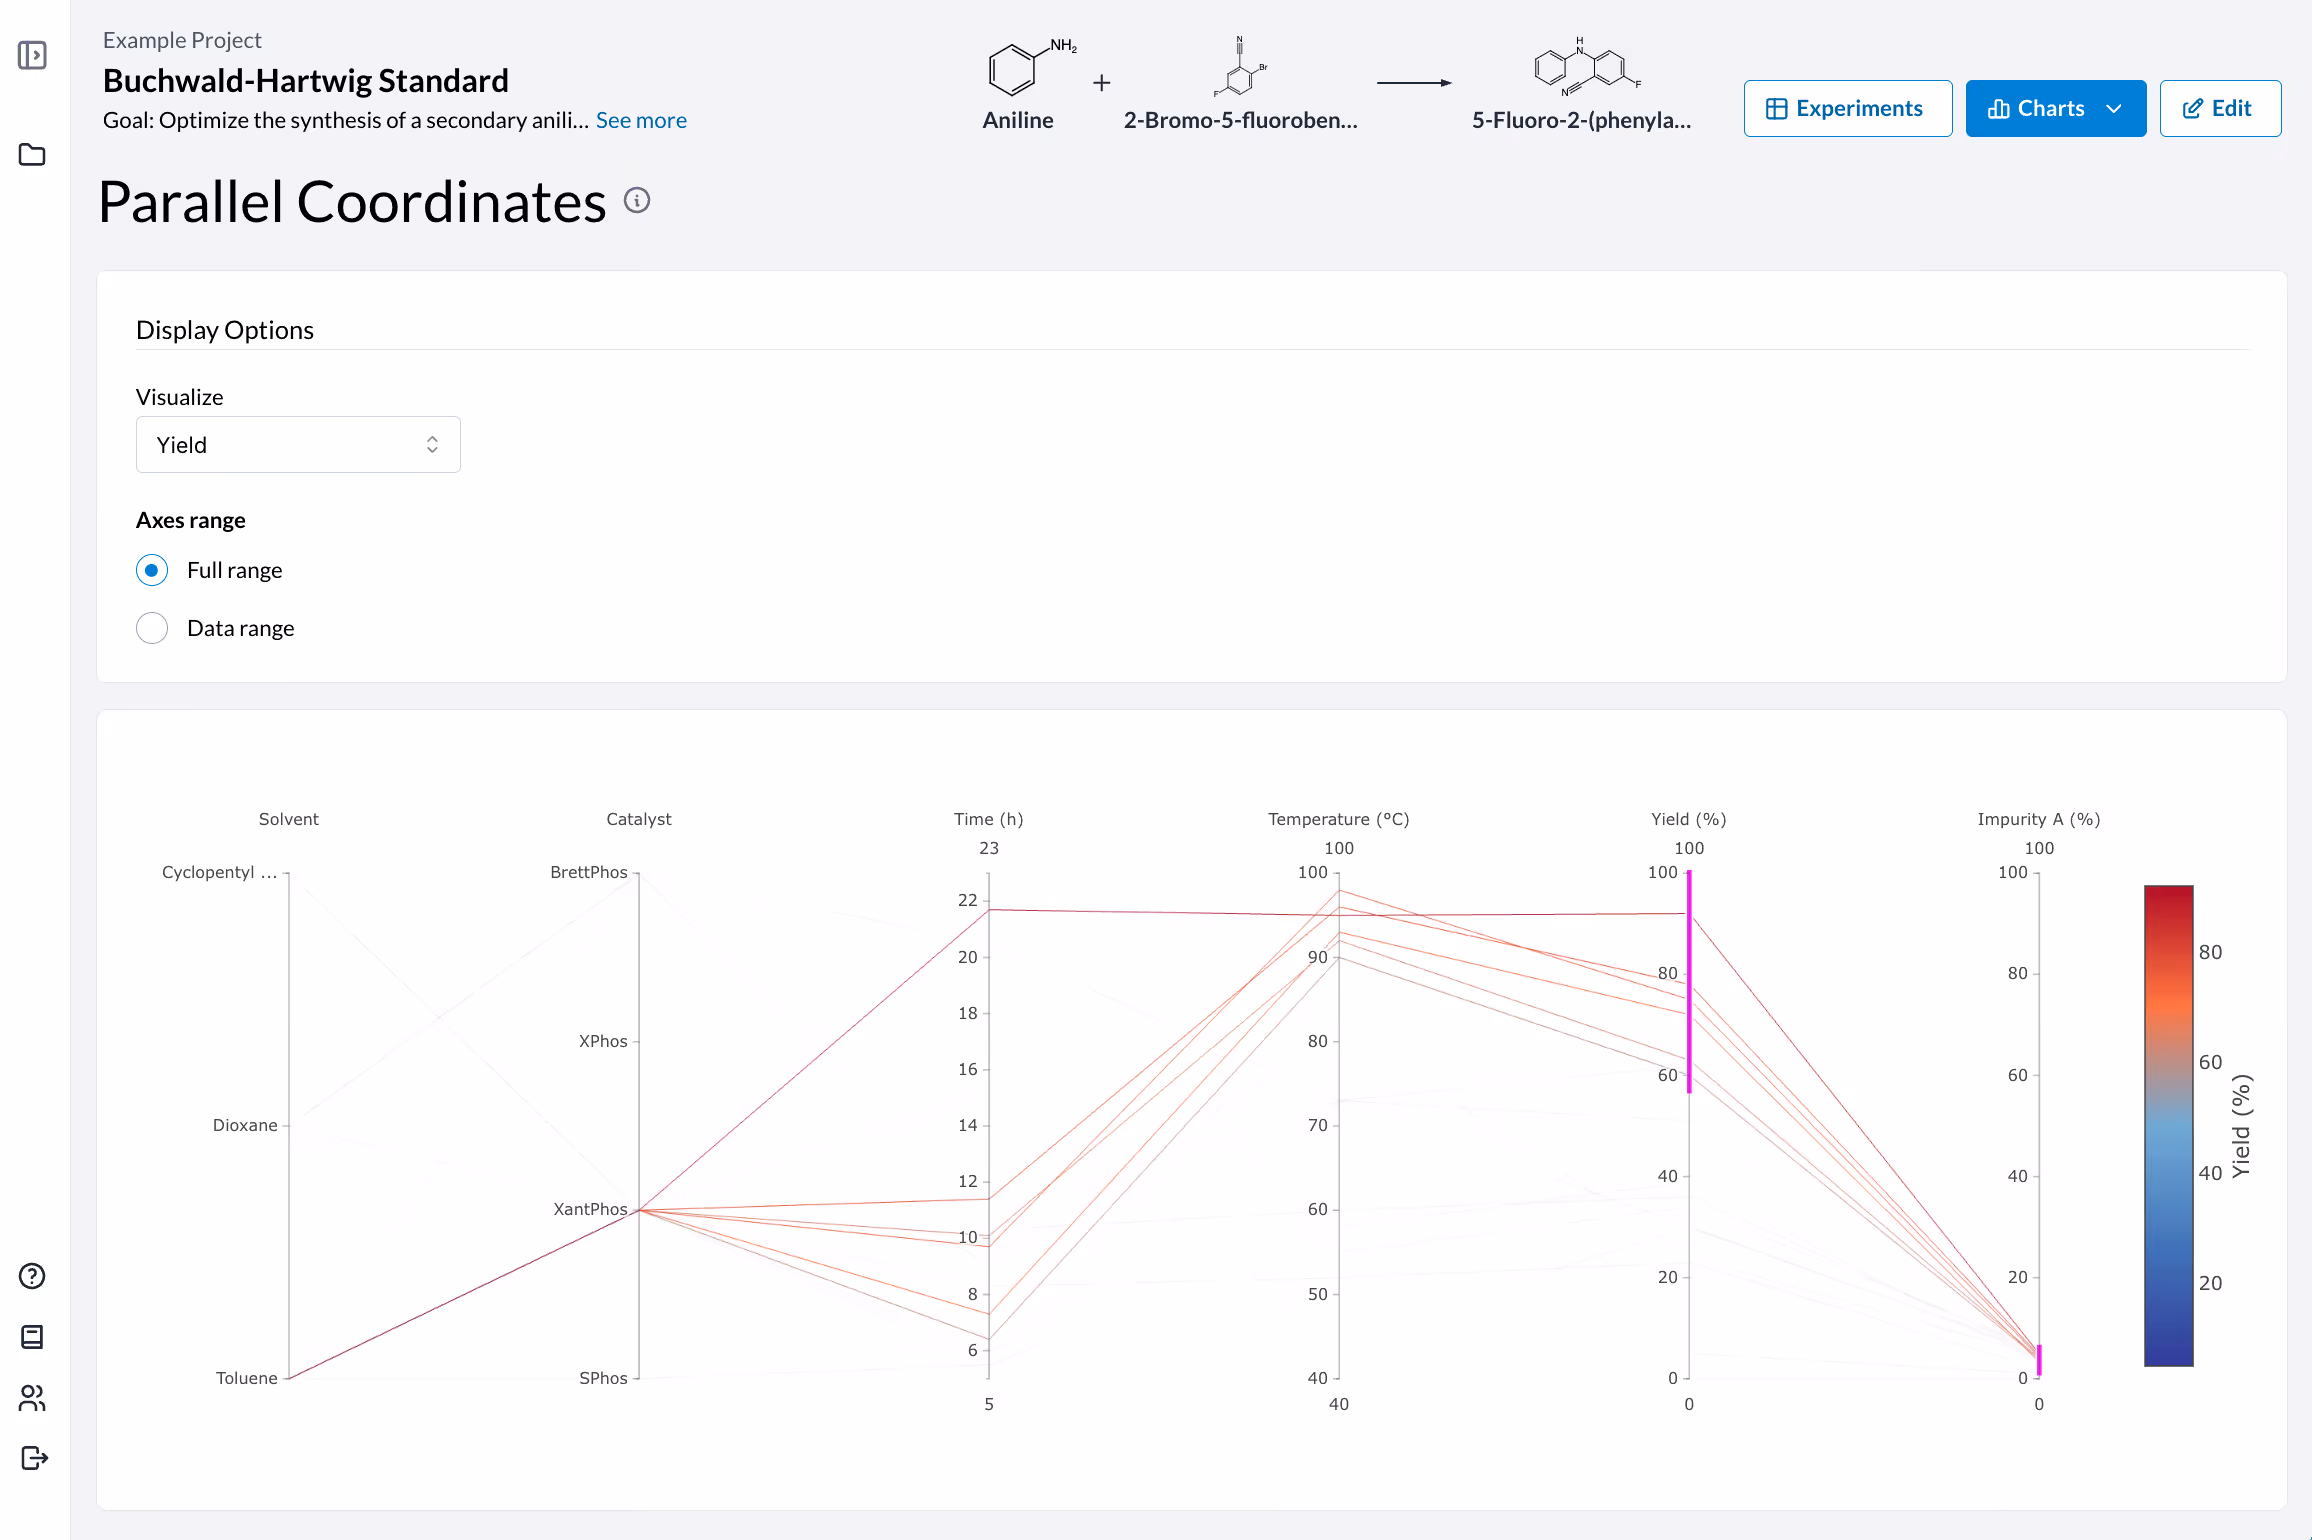
See it for yourself in the clip below showing our parallel coordinates plot - watch what happens when filters (yield >60%, impurity <5%) are applied to a complex dataset.
A trend that was invisible suddenly becomes impossible to miss and points you towards promising regions for temperature, reaction times, etc.
If your team is sitting on process data that isn't working hard enough for you - we'd love to show you what that looks like when it changes.