
Reactant consumption. Product formation. Impurity buildup. Seeing how your species behave over time is the foundation of kinetic modeling. We just made that a single click.
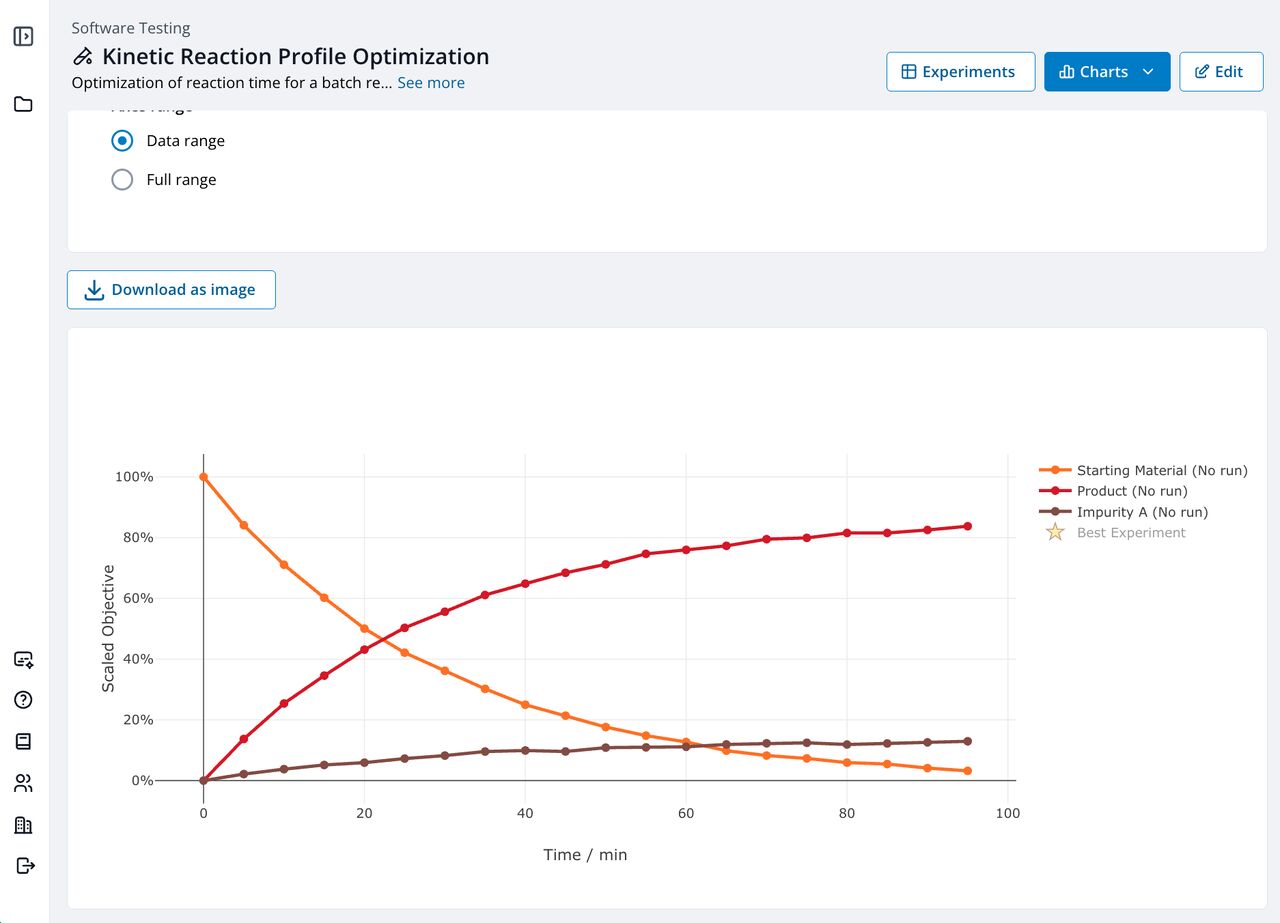
Reactant consumption. Product formation. Impurity buildup. Seeing how your species behave over time is the foundation of kinetic modeling. We just made that a single click.
ReactWise now lets you group time series data by separate runs and visualize all your kinetic curves side by side - instantly.
Product formation across different temperatures. Impurity profiles at different starting concentrations.
All in one view, immediately comparable.
This is particularly powerful for medium throughput chemistry, where you're sampling large amounts of kinetic data across multiple conditions and need to rapidly understand how your system behaves before committing to a full analysis.
See your species of interest. Understand the trends. Spot the anomaly. Identify the decomposition.
And once you have that picture - Kinetics360 takes it from there.
With your data already grouped, structured, and visualized, you move directly into full kinetic model identification without any of the manual preparation.
From raw time series data to kinetic insight. In a fraction of the time.